Juniper Apstra Demo: Multivendor Flow Data

Dig into the details of your network with Juniper Apstra multivendor flow data.
To keep traffic running smoothly on your network, you need the ability to easily identify issues. With multivendor flow data, Juniper Apstra® now provides visibility down to the applications running in the data center; find out how by watching this video.
You’ll learn
How to easily debug in Apstra when users are reporting slow internet traffic
How to isolate potential problems by filtering specific time periods using multiple methods
Who is this for?
Experience More


Transcript
0:00 foreign
0:04 [Music]
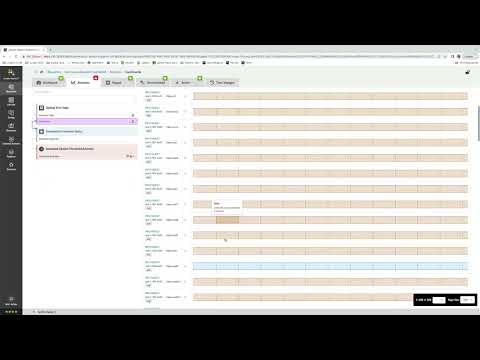
0:07 here's the main overview dashboard for
0:09 The Collector from various protocols
0:11 like netflow ipfix and S flow
0:16 as you can see there are various
0:18 dashboards to see views on your flow
0:20 traffic which we will see a few in more
0:22 depth than upcoming examples
0:25 each dashboard has the ability to filter
0:27 for specific information to dig into the
0:30 details of your network
0:33 let's start with an example we'll create
0:35 a filter on the SSH service to see all
0:39 SSH related traffic then we can dig into
0:42 SSH traffic where the connection was
0:45 reset by clicking The rst View
0:48 to dig into the details further on all
0:51 the SSH traffic we'll select the select
0:54 flow records dashboard and see the
0:57 filters remain
0:58 this will provide details and views on
1:01 exactly which flow records have a reset
1:03 event to understand what is happening in
1:05 the network now let's clear the filter
1:07 to look at another use case around
1:09 performance
1:11 say users are reporting cases of slow
1:14 internet traffic how do you debug what
1:17 is going on let's start with picking the
1:19 device and interfaces facing the
1:21 internet traffic then we can jump to the
1:24 top end and see the filters again carry
1:27 over as we switch dashboards we can then
1:31 look at top talkers top Services top
1:34 apps and top conversations
1:37 in the top talkers view we can see one
1:40 client is consuming all the bandwidth if
1:43 we look at that specific client we can
1:46 dig into the details to see the traffic
1:48 is all flowing to Netflix
1:50 apparently someone is streaming movies
1:53 which is consuming all the bandwidth
1:57 let's clear the filters again and look
2:00 at another use case around core services
2:02 this would involve items like DNS
2:06 DHCP radius ldap and ntp important
2:12 services for sure we can pick one like
2:15 DNS to start looking what is going on
2:18 and even dig into specific time ranges
2:20 to isolate potential problems
2:23 as you can see there are multiple ways
2:26 to filter specific time periods from
2:28 manually selecting windows in the UI to
2:31 picking common time windows in the easy
2:33 drop down menu
2:38 [Music]
