How to Be a Data Center Analytics Superhero With Juniper Apstra

Leverage Juniper Networks Apstra’s intent-based analytics to improve network operations.
Do you know if your network is operating as expected? See how Juniper Apstra® software’s extensive pre-built, intent-based analytics with custom collectors and dashboards help you be an operations superhero in this presentation recorded during Tech Field Day 18.
Learn more about Juniper Apstra software.
You’ll learn
How to collect valuable data, enrich it with knowledge from the vast Juniper Apstra graph database and create new visualizations
How custom alerts in Juniper Apstra software can provide better insights and information about your data centers or AI clusters
Who is this for?
Host

Experience More


Transcript
Introduction
0:10 um my name is Kyle Baxter I am a senior
0:14 product manager here at Juniper working
0:16 on our abster solution with me I have
0:19 Raj hi guys I'm Rajiv and I am part of
0:22 the Engineering Group um my team mainly
0:25 looks into Telemetry and uh device uh
0:27 life cycle management thanks r so today
How to be an Operations Superhero
0:31 I'm going to teach everybody how you can
0:33 be an operations superhero um and so
0:38 make sure you ask the the hard questions
0:40 we have Reeve we have the team that
0:41 built the stuff that I'm going to talk
0:42 about in demo today um so we have the
0:45 the experts in the house um but you've
0:48 heard us talk a lot about um deploying
0:52 networks and and designing and building
0:54 while that's incredibly important
0:56 because the more time you spend in
0:58 designing the easier it's going to be to
1:00 operate your network later on um because
1:02 you don't want to go back and design
1:03 design and rebuild it over and over
1:05 again um so the hope is with with abstra
1:08 um you can design it once but then
1:11 you're going to need to continue to
1:13 operate it so there is a lot of need on
1:16 how do I continuously operate and manage
1:18 and know my network is operating as
1:20 expected so that's what I'm going to
1:22 talk about today is is two new features
1:25 that that we have coming up one that's
1:27 already available and one that's about
1:28 ready to come out on how the first one
1:31 is how you can um be able to manage and
1:35 um capture collect and analyze anything
1:39 in the network um and we'll see some use
1:42 cases on that here in just a second and
1:43 then I'm going to sneak peek into a new
1:46 feature coming up on Flow so um with
1:50 that as I said operations is already a
1:53 key pillar of abstra and we have um
1:56 intent-based analytics so ibaa when you
1:59 see the word ibaa that's what it means
2:00 intent-based analytics um probes that
2:03 collect analyze enrich data we have
2:06 several that are on out of the box
2:08 things like that monitor device health
2:09 things that monitoring your traffic um
2:12 you know those kinds of things we have
2:13 ones that are specific to what choices
2:17 you make when you deploy so there's
2:19 about 30 plus others that you can turn
2:20 on demand so things like if you pick an
2:23 evpn VXL fabric you can have it m
2:25 monitor type 3 Type five routes if
2:27 you're using Optics you can have it
2:28 monitor those Optics those kinds of
2:30 things but what about the use case if I
2:34 want to manage something out of the box
2:37 um so if you just heard James's session
2:38 if you missed it go watch the the replay
2:41 um but um things like AI clusters and so
2:44 there's very unique things about an AI
2:46 cluster and there's probably unique
2:48 things you want to manage like buffers
2:49 and qos and all the specific protocols
2:52 that are in an AI cluster what do you do
2:55 so let's pop the the virtual hood of
2:58 abstra and see how data is actually
3:02 collected um so Telemetry data is
3:05 ingested in abster Via Services called
3:07 collectors and you can see you know some
3:09 screenshots of abst and here things like
3:11 we collect ARP and bgp and mac and
3:13 interfaces and lldp standard things that
3:15 you would expect and we use those to
3:17 wire them into our intent-based
3:19 analytics engine and we'll see that in a
3:22 second and and you'll see that the power
3:24 that that can provide um but if you want
3:27 to go build your own up until just
3:29 recently we had an SDK um but how many
3:33 of you are are python
3:36 gurus yeah Reeve you should be raising
Custom Telemetry Collector
3:38 your
3:39 hand but other than Reeve who's on the
3:41 development team the rest of us might be
3:43 able to dabble in some Python and play
3:45 around with it but we're not developers
3:47 right we're operators why we have
3:49 documentation on how you can do it you
3:51 can use an SDK and write some python
3:53 code that's not what the the use case of
3:56 what we're getting back from the field
3:57 so people tell us like this dude not a
4:00 developer I'm an operator and so what
4:03 we're what we're releasing and what we
4:05 just released is a feature called custom
4:06 Telemetry collector and it tailors to
4:09 that operator experience so we'll keep
4:11 those sdks for those that that love
4:13 writing python um but just now in our
4:16 420 feature so you can go download this
4:18 now you can go try it in our demo
4:20 platform Appster cloudlabs and you can
4:22 see this in action today but at a high
4:25 level this is a uid driven workflow that
4:28 is based on CLI commands and I'll talk
4:31 just a second on why we're using CLI
4:33 commands um that you can customize and
4:35 pick which devices you want to run it on
4:38 and then we'll see the true power of how
4:40 you leverage that with our Iva engine
4:44 that intent-based analytics
4:46 engine so just a quick side on why we're
4:49 relying on CIS everybody's familiar you
4:51 know the CIS if I ask any operator you
4:54 know what do you do when you get the
4:56 call that your Network's outage you know
4:58 there's a list of show commands you're
4:59 going to run everybody knows those um so
5:02 everybody's familiar with those um they
5:03 have the coverage we are actively
5:06 looking at ways we can use some of the
5:08 streaming capabilities from devices
5:11 going forward but CLI is the the easy
5:14 way to start and that's what everybody
5:15 knows that's what we're starting with
5:16 today so we'll see that here in the
5:18 demos so the first step is starting with
Identify Source of Data
5:22 identifying your source of data um and
5:26 so just now in our our newest releases
5:28 you can now execute
5:30 CLI commands directly from the Appster
5:32 UI so no longer do you have to open up a
5:33 separate terminal session run a command
5:36 capture the output copy it whatever you
5:38 can now natively do it when within
5:40 abstra so this is our first step
5:43 building block you can now run CLI
5:45 commands and abstr all right that's
5:48 great so now we can use that we can
5:51 define a collector and it's four easy
5:53 steps um but you start with defining a
5:56 new collector and in there you have to
5:58 Define a key and value pair um so like
6:02 anything Keys what you wantan to what
6:04 you're looking for the value is your
6:06 output so I'm going to go through an
6:09 example we're going to use a command
6:10 called show BFD session so that command
6:12 if you're familiar with it shows a list
6:14 of of neighbor IP addresses in a state
6:18 up or down pretty simple so those
6:21 neighbor addresses would be our key
6:23 that's what we want to look for and and
6:25 what we want to key off of the Upp or
6:27 down state is the value so that that's
6:30 what we use for key value mapping
6:32 pairing um and because up or down is a
6:35 string the value type we put as a string
6:37 it's not an integer um and so we give it
6:39 a human readable name for a key we just
6:41 call it
6:42 neighbor then we can specify the target
6:45 platform this is how we specify which
6:47 devices in our fabric we want this to
6:48 run on um and then we put in that
6:51 command um we're going to use that show
6:53 BFD session command and you see the
6:55 schema all loaded there then finally we
6:58 have to map that that schema that uh
7:00 neighbor and value to those keys and
7:03 values we set up in the beginning okay
7:06 you're probably going all right you m
7:09 some key values to a show BFD session
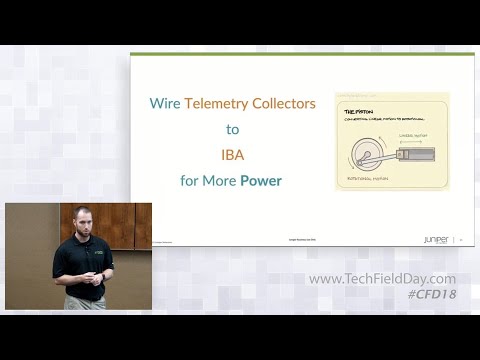
7:11 okay great what can you do with that so
7:15 let's look at that because the true
7:17 power is when you wire those collectors
7:20 into an intent based analytics engine
7:22 because when you add analytics to Raw
7:23 data that's when it becomes useful um
7:27 and so that's what we're going to do
7:28 we're going to um create an intent-based
7:30 analytics probe and then we're going to
7:33 wire processors on top of that so
7:36 there's a whole list of processors that
7:37 you can see that we can add to it from
7:39 things like ranges counts min max
7:42 averages comparisons and so forth you
7:44 can see the whole selection there of
7:46 processing we can do on Raw data um and
7:50 that's really where we get the the power
7:53 and the
7:54 value so let's see it let's start here
Create Probe
7:58 um then we're going to to create a new
8:01 probe um and so we'll give it give it a
8:04 a name um and I'm going to fast forward
8:07 through a little bit of this um just
8:10 because of time um so here we've already
8:13 given it a name and what we're going to
8:14 pick is a graph query so this is picking
8:18 what devices in our fabric we want it to
8:20 run um and so if you're not a graph
8:22 query expert don't worry they're they're
8:24 all labeled there's already preset
8:26 queries that basically cover everything
8:27 you could need if it's not there's an
8:29 easy graph building tool that we have in
8:31 abstra to go build your own queries um
8:34 but this is how abstra is built under
8:35 the hood is a graph database so you do
8:38 have to you know pick the query you want
8:40 and so as you can see here I'm going to
8:42 pick all managed devices um so I didn't
8:44 have to know how the query I just picked
8:46 it and TAA I I have it so then the next
8:50 things I need to do is assign it what
8:52 are the system IDs um and so it's almost
8:55 always system. system ID um then we give
8:57 it a service name this is that collector
8:59 that we defined just a couple minutes
9:01 ago and now then I think we I think we
9:05 got to put in what the the value is or
9:09 the or the data type um which it's a
9:12 string and it's a dynamic string because
9:14 it can be up or down um so we've added
9:17 in a couple little Fields here and what
9:20 we'll see is we've now defined a probe
9:23 that'll go out every in this case it'll
9:25 be every two minutes but you can Define
9:27 the intervals and run that show bef
9:29 session on all our devices in our Fabric
9:32 and collect States so here you can see
9:34 on Leaf 2 all the neighbor addresses and
9:37 the the values so we've collected a
9:41 bunch of
9:42 information the next thing we're going
9:44 to do is we're going to enrich that data
9:49 um and so like I said appst is built on
9:52 a graph database underneath and what we
9:54 have in that graph database is
9:56 relationship information about
9:58 everything in your fabric so what
10:00 devices are connected to what via what
10:01 interfaces what links all this
10:04 information so what what I'm doing here
10:07 is picking a more interesting query that
10:09 has information about um that neighbor
10:12 address so things like what is the um
10:16 what is the the interface it's on what
10:18 is the device role what is the Remote
10:20 device what is the Remote device name so
10:23 what I'm doing is pulling all that
10:25 information so I'm going to skip ahead a
10:27 little bit here um and you I've added
10:29 four additional Keys about local
10:31 interface local Ro remote interface
10:34 remote system so we going that's kind of
Combine Data
10:37 cool but what this has done and the
10:39 power this has done is we've now
10:41 combined pulling information from a show
10:44 command on the device the information
10:45 that abstra knew about so we've overlaid
10:48 that information to give you even more
10:50 information and more power so now you
10:52 can see I know it's a little um small um
10:56 let me see if I can zoom in here a
10:58 little bit um you can see there on Leaf
11:01 2 it's to a generic device what
11:03 interface what the remote system is it's
11:05 a looks like it's a a router some kind
11:07 of Gateway on the remote interface what
11:09 the IP address is and the value so not
11:12 all that came from that show BFD session
11:14 all I got from the show BFD session was
11:15 an IP address and a value but that other
11:17 information I got from the graph
11:19 database and abstra so that's the some
11:21 of the value that we can we can pull in
11:24 we can combine that information together
11:26 so now you're probably going okay
11:28 interesting
11:29 you've combined information from a show
11:31 command with information that's already
11:33 in in the abstr graph database and
11:35 combine it into something more powerful
11:37 and useful but what else can I do with
11:39 it and this is where we can add those
11:42 additional processors that I mentioned
11:44 that whole list of processors because
11:46 it's like when you're looking at this
11:47 pile of Legos if I ask you about you
11:49 know what do I have there on the on the
11:50 data side you would just be like I got a
11:52 pile of Legos I don't know how many
11:54 colors I have what color more than the
11:56 others I don't know anything but the
11:58 values when you start sorting it
12:00 arranging it presenting it visually
12:01 enriching it that's when you start
12:04 getting value out of your data because
12:05 just collecting data isn't useful just
12:08 data but when you do something with it
12:10 that's when you get true power that's
Usage Limitations
12:13 what do is there any usage limitations
12:15 or or having run SAS products that scale
12:20 I know if you set your customers free on
12:21 being able to do a bunch of narly graph
12:23 queries you find out really quickly that
12:25 people don't know how to write good
12:26 graph queries and they will ravage your
12:29 system performance yes we actually
12:31 thought of that and we have an a ibaa
12:34 probe intent based analytic probe that
12:35 monitors the other
12:37 probes so we wrote a probe to monitor
12:39 ourselves um so that way we can check
12:41 your probe health so say you have it
12:43 running say you have it set in interval
12:45 every 10 seconds and it's an intense
12:46 command maybe you said it even every
12:48 second you want it to run every second
12:49 because you want to know instantly
12:50 what's going on but it's overloading the
12:52 device we'll see two things happen we'll
12:54 see maybe CPU in the device because
12:55 we're monitoring that we'll also see you
12:58 know your your health of your Telemetry
12:59 service that collector is probably
13:01 degrading so we'll see it like you may
13:03 be asking it pulling it every second but
13:05 it takes a second and a half to respond
13:07 because it's an intense command or
13:09 something like is that kind of an
13:10 example then you can start seeing Oh I'm
13:11 falling behind and it starts alerting
13:13 you and you'll get alerts that hey
13:15 you're degrading either abstra or the
13:17 devices because you're you know you're
13:19 overloading it doing too much it's like
13:21 the good old days we used to overload
13:22 the span Port monitoring the other ports
13:24 yeah so this way we monitor ourselves um
13:28 but here I'm going to show you um how
13:31 you can add additional processors so
13:33 we're going to add two processors here
13:36 um the first one is a count processor
13:39 and this this would be counting the
13:40 sessions because we saw example earlier
13:43 like Leaf 2 it had a whole bunch of
13:45 sessions um so it was nice that we
13:47 listed them all out but what if we
13:49 wanted a simple count this is what we
13:51 can do so we can add a processor and we
13:53 can do call it count um and what we'll
13:56 do is we'll give it then a name and
13:58 again I'm going to just fast forward a
13:59 little bit here um and what we're going
14:01 to do is reference our um I want to jump
14:05 right here and we're going to reference
14:07 our existing start probe that collected
14:09 the data and we're going to say count
14:11 the number of um of states that say down
14:16 um so then we get a count and so now as
14:20 instantly builds a a nice little visual
14:24 you get gauges that show you how many of
14:27 them are down so we can see exactly on
14:28 two we have six sessions that are down
14:32 and on other ones we have no sessions
14:34 that are down so the next processor that
14:37 we're going to create is called range so
14:40 this is where we can use to say um and
14:43 alert ourselves if some kind of
14:45 threshold is crossed so in this case we
14:48 don't want any down sessions we want
14:50 them all to be up so what we're going to
14:52 do is create a range processor um that
14:54 is going to um look for you can see I
15:00 want it to be more than or equal to you
15:02 could say less than or equal to or equal
15:03 to you can pick some variables and um
15:06 oops I didn't mean to click advance I
15:08 meant
15:10 to let's see if I can go to
15:12 play um and here goes so the range and
15:17 so we'll pick more than or equal to um
15:20 one so we want to be um alerted when
15:23 there's more than one session down on a
15:26 device that we're monitoring for we want
15:28 it to raise anomaly and the other cool
15:30 thing we can do is add metric logging so
15:33 this is historical logging so we can
15:36 look back in time up to a full year or
15:39 any interval in between hours days um or
15:43 up to that year we can look back in
15:45 history so now what you can see there is
15:49 we now have the ability to if I go back
15:52 just a second right there um you can see
15:54 there gauges on different devices where
15:57 some are red and some are not so the
15:58 ones that are
16:00 red um have more than that threshold
16:03 that we set one because we want to be
16:05 know when any of them cross that
16:06 threshold of one so we can see Leaf two
16:08 it has six out of 10 that are down spine
16:10 one has sixc sessions but they're all up
16:13 so none of them are down so that one's
16:14 fine um so then even if I fast forward a
16:18 little bit in
16:19 this
16:21 demo we can then just look at anomalous
16:24 ones ones that have crossed that
16:26 threshold that we cared about and and we
16:28 can see oh there's two devices Leaf one
16:30 and leaf two our other Leaf devices and
16:32 our spine devices are fine from what we
16:34 defined but those are the two devices
16:36 that we probably need to look at so
16:39 because this is part of our intent based
16:41 analytics engine we can then add this
16:44 straight to a dashboard so this is where
16:46 in the the previous session if you
16:48 missed it go back watch James's session
16:50 on building AI clusters you could do
16:52 something like this you could build your
16:53 own collectors based on what you care
16:56 about in an AI cluster you could then be
16:58 able to build anomalous ranges where you
17:00 care about and build dashboards and this
17:02 is exactly what we're doing and and
17:04 James showed a quick little preview of
17:06 it but this is where we can get to of
17:08 being able to build this and so you can
17:10 now with this feature any command you
17:13 care about you can collect the data and
17:16 build dashboards to report on what
17:18 you're caring about and it can
17:19 constantly pull and alert you when
17:22 thresholds or when something changes
17:24 that you want to be alerted on so I got
Comments
17:27 a couple comments on on on what I've
17:30 seen so
17:32 one um again this is great for someone
17:36 that you know obviously knows uh how to
17:39 you know how to work with this uh with
17:41 particular tool but as you mentioned if
17:44 it's actually you know monitoring the
17:46 the queries that I've built you know
17:49 just in case I made a mistake then why
17:51 not take the next step and actually you
17:54 know go ahead and create a dashboard you
17:58 know for you know for the customers as
18:00 part of this portal that covers you know
18:03 the I would say the very popular things
18:05 that you would look for uh and if it
18:07 requires any sort of uh you know fairly
18:12 uh small or quick uh setup in terms of
18:14 you know determining the devices and so
18:17 on and so forth that needs to actually
18:18 be you know visualized in that dashboard
18:21 just set it up as a as a you know as as
18:23 some sort of a wizard um with relevant
18:27 questions and you know don't let me
18:29 start typing in you know certain stuff
18:31 that might be right might be wrong the
18:34 query can can be all messed up um and
18:37 just make it a whole lot easier so
18:39 that's just one comment the second one
18:42 would be to actually go ahead and Export
18:45 this to you know to other tools you know
18:48 visualization tools that you know would
18:50 be just you know popular with with
18:52 within the organizations instead of
18:53 having a separate dashboard to look uh
18:56 into you know that type of equipment so
18:59 just for example you know having it
19:01 exported to
19:02 grafana um just as an example is it
19:05 something that's
19:06 possible um yes so I'll start with your
19:09 second question can you export it um um
19:12 yes we have availability via um we have
19:15 streaming capabilities coming from
19:16 abstra via grpc we have syis log we have
19:20 apis so there's multiple ways to get the
19:24 same information out um and into if you
19:27 have other tools you're using for for
19:30 monitoring absolutely we we have that
19:33 capabilities um so on your your first
19:35 part of your question um yes we are
19:37 looking at ways to simplify and
19:38 streamline some of those um uis we saw
19:42 um to make it even easier and in
19:44 foolproof in a way um we're also um
19:47 we'll take probably popular examples and
19:49 we'll add them to you know the pre-built
19:52 IBA probes that we have in the product
19:54 we're also potentially looking at maybe
19:56 could we you know we already have you
19:57 know get with other things like the
20:00 terraform information could we have you
20:02 know those as being popular spots that
20:04 uh for custombuilt probes we have those
20:06 uploaded to there where people can
20:08 download them and import them those are
20:10 all things that uh we're definitely
20:12 considering so yes very good feedback
20:14 thank you that would be very helpful one
Application Flow Data
20:17 more quick thing so I'm gonna try to do
20:19 this in like two or three minutes um and
20:21 and wrap up with uh one more cool thing
20:25 that we are um working on um so we've
20:28 talked a lot about um operations we have
20:31 um out of the box to to monitor the
20:33 health of your devices your
20:35 infrastructure with the the custom
20:37 Telemetry collector we can you know get
20:40 any other services show commands that
20:42 you have but the the the key and we
20:44 talked about this in some of the other
20:46 sessions and go watch the recordings if
20:47 you missed those is what about what's
20:50 going on with your applications and so
20:52 we teased this a little earlier so I
20:54 want to um show you what we're working
20:56 on as far as collecting application flow
21:00 data and so this is things about
21:02 understanding why is my service slow
21:03 who's consuming what am I getting you
21:06 know bad attacks from the outside um
21:09 what about um cost from usage
21:11 perspective so we are adding a new
21:14 feature called apps or flow data and so
21:17 this will be collecting things like s
21:19 flow net flow ipix IFA and from any
21:23 vendor this will work with any vendor
21:26 that uh that appst supports we can
21:28 collect that information and visualize
21:30 that so I'm going to show you a quick
21:32 demo here and this will be the last
21:33 thing I have um on how this looks so
21:37 we'll start here we are on our dashboard
21:40 of visualizations um so this is our
21:43 visualization of all that flow
21:45 collection that we're that we are
21:46 getting so if I find the play button I'm
21:50 going to go through a couple different
21:51 tabs and so um going to flash the room
21:54 real quick but we'll go through a couple
21:55 examples of how these are used so you
21:57 see things like top end core Services
22:00 threats flows um geography graph
22:04 relationship information um various
22:06 different ways that you can interpret
22:09 this flow data um and so let's start
22:13 with an example so what if you want to
22:15 look at a specific service like SSH um
22:18 so you can create filters and so we'll
22:20 filter on um SSH as a service and we'll
22:24 automatically see all the dashboards
22:25 change and we see that there's some
22:28 resets well in SSH resets are not a good
22:31 thing so we can dive into those and we
22:34 have filters across the top and as we go
22:36 against the different dashboards those
22:38 filters persist and we can look into
22:40 specific things about that filtered flow
22:43 traffic so in this case we can look at a
22:46 specific SSH reset um um issue and we
22:50 can see the details so it's clear
22:54 question yes maybe maybe a dumb question
22:57 but are we looking in to something I'm
22:59 just not familiar with that particular
23:02 uh tool um is it the data we're looking
23:05 at is something that is proprietary for
23:07 that particular tool because I mean it
23:09 looks like something that I can find in
23:11 you know in in Elk if if I stream that
23:14 that data over there so what's unique
23:17 about what we're looking at um so what's
23:21 unique about it is is the the enrichment
23:24 that we're adding to the data um so the
23:27 data isn't proprietary it's using you
23:29 know Common sflow net flow ipix
23:32 protocols that's all standard right
23:34 that's been around for for years devices
23:36 can stream it and you're right there's
23:37 there's other things out there where you
23:39 can visualize that data but it's
23:41 collecting it all for you and enriching
23:44 it what we found is talking to a lot of
23:46 customers is um most people they might
23:49 you know collect it by hand or or when
23:51 necessary um but they don't have a good
23:54 way of collecting it enriching it and
23:56 visualizing it so that's really where
23:58 the differentiation comes in is the some
24:00 of the um enrichment we're doing for for
24:02 like geolocation um threat analysis
24:06 those kinds of things is where we're
24:07 doing some of the additional um value
24:11 does that
Logs24:13 help yeah maybe a follow up on that one
24:15 so I mean obviously we're talking about
24:18 you know quite a lot of of logs so I
24:20 mean would you have to actually go ahead
24:21 and set up H something that is
24:24 proprietary for for the tool actually go
24:27 ahead and and receive all that
24:29 stream uh of data then start you know
24:32 aggregating it so you'll be able to
24:34 visualize it or you can rely on existing
24:38 uh setup of again example just an
24:41 elk um that would that would have those
24:45 logs yeah so the speaker is breaking out
24:48 a little bit but I I think I understood
24:51 your question slightly so I'm going to
24:52 try to answer it and if I don't um try
24:54 repeating it they're playing with the
24:55 speaker right now um but but um as far
24:58 as setting it up it's not using
25:00 proprietary things um like I said it's
25:02 just you know things like sow it's been
25:04 around it's configuring s flow on
25:06 whether it's a juniper device a Cisco
25:07 device or an Arista device um in setting
25:10 it you know how often you want to sample
25:11 the data how often you want to send it
25:14 those kinds of things um and then and
25:16 then we collect it enrich it analyze it
25:19 and and enrich it um so I don't know if
25:22 that fully answered but maybe the
25:23 speaker's uh fixed again here so if you
25:26 if that didn't quite answer it try ask
25:28 again no just uh again just a
25:31 clarification so does it need to store
25:33 it somewhere or is just uh it just looks
25:37 at the string ah storage so so yes we're
25:41 we're using open search um database
25:43 which is an open source version of of
25:45 elastic um to store the database but
25:48 this is this is built like abstra from
25:50 our previous sessions if you remember um
25:52 is an on-prem application so this would
25:54 be you know an on-prem not Cloud
25:56 consumed um so so that way you're not uh
26:00 eating Cloud cost potentially for the
26:02 the large amounts of data so this would
26:04 be just a storage you have locally in
26:06 your data center thank
26:14 you
