Juniper Mist Premium Analytics


By storing up to 13 months of data, Juniper Mist Premium Analytics enables IT and line-of-business users to obtain long-term insights to help them with capacity planning, security, and more.
You’ll learn
How Mist Premium Analytics works
How you can use the data to get answers to business problems
Who is this for?
Host


Transcript
0:09 and for those who don't hear my name
0:11 already I am sunolini I am part of the
0:13 AI driven Enterprise product management
0:15 team and we've spoken about a lot of
0:18 topics before in previous mmds you heard
0:20 a lot of new things that we have
0:23 announced today I'll be talking to you
0:26 about an offering we have called premium
0:29 Analytics
0:30 and the reason it's called premium
0:32 analytics is because it's actually
0:33 delivering analytics or long-term
0:36 contextual insights on some of the
0:39 machine learning and AI action based
0:42 insights we provide within the MIS
0:44 Portal itself
0:45 everything you saw today in the MIS
0:48 Portal and what we've shown in previous
0:50 mfds has been all about simplifying
0:52 network operations trying to measure the
0:55 user experience trying to simplify the
0:57 user experience
0:59 um
1:00 or root cause issues that impact user
1:02 experience but the question that has
1:04 often come up from all the customer that
1:06 I work with across various verticals is
1:08 hey this is great that Marvis did that
1:11 or you found this root cause of that
1:13 root cause but how these root causes
1:15 trending how can I use this fantastic
1:18 Rich Telemetry you have in the cloud to
1:22 give me answers to business
1:24 problems business problems right
1:27 capacity plans business problems like
1:29 how is my RF doing yes it's great that
1:32 RM solved everything but what is it that
1:34 I'm seeing as a pattern continually in
1:37 my RF Network business problems like
1:40 security you know we don't talk about
1:42 with whips anymore but that question
1:44 comes up all the time what are my
1:47 security alerts on my wireless network
1:49 are my neighboring APS becoming more
1:52 impactful to my Wi-Fi network operation
1:55 especially in higher ed compared to my
1:57 rogue APS what's going on what is the
1:59 trending look like so a premium
2:02 analytics came into Play It's targeting
2:04 both our line of business
2:07 organizations as well as network ID now
2:10 a little bit of History here
2:13 when Prem analytics began it began with
2:16 the sole purpose of answering some of
2:18 the line of business questions around
2:20 traffic analysis say how many visitors
2:22 how many employees how many Shoppers am
2:24 I getting in my venues what's the
2:27 traffic flow like for that we needed to
2:28 have a longer term view as to how is
2:31 traffic moving across across public
2:33 spaces very soon that pre-maletic
2:37 solution started evolving towards a more
2:40 Network I.T based inside solution it was
2:44 all about providing long-term trends on
2:48 the contextual insights we already have
2:50 in the cloud but how can we again use
2:53 that data use that visualization to
2:56 answer questions that deliver business
2:58 outcomes so what began as a line of
3:01 business tool
3:02 very quickly pivoted towards also
3:05 helping answer Network questions again
3:08 for business outcomes
3:11 so some examples here about what are
3:13 these business outcomes a common one
3:15 capacity planning right
3:18 you saw West talk about the capacity SLE
3:20 you saw the coverage SLE you've seen the
3:23 Maris actions we have about hey there is
3:26 potentially a capacity issue here you
3:27 need to add another AP
3:29 but from a long-term trending
3:31 perspective if you are trying to see
3:33 certain locations as especially now in
3:35 in the Enterprise space as users are
3:37 coming back to work you want to look at
3:39 okay how is my Trend in terms of
3:41 capacity usage do I have enough capacity
3:43 in the air do I have enough capacity on
3:45 my wired Network do I have you brought
3:47 up the the charter uh Grand link do I
3:51 have enough capacity on my van circuit
3:52 because the traffic patterns are
3:55 changing
3:56 yes we will do what we can to again
3:59 measure the user experience with the
4:01 current state of affairs but is there a
4:03 long-term view here is there a policy
4:05 change we have to make is there an up
4:07 leveling of the network itself that we
4:09 have to do because we're hitting Peak
4:10 whether it's Peak on Wi-Fi Peak on wired
4:13 picon man how do you know you know
4:15 because we have the data we have the
4:18 context and now it's premium analytics
4:20 we're able to deliver deliver for you a
4:23 longer term view a full Insight on that
4:25 contextual or rather a full trend line
4:27 on that contextual Insight around Wi-Fi
4:31 capacity is it hitting the limit around
4:34 wired capacity am I wired switch up
4:36 things hitting the limit around the van
4:38 circuit again beauty of being full stack
4:40 I get Telemetry from the wireless
4:42 network the wired Network the wire
4:44 Network we are now able to give you that
4:47 full view of what are the capacity
4:49 limits coming into and then what policy
4:52 changes you need to make because we are
4:55 hitting capacity no matter all the
4:57 optimization we do
5:00 um another one here you see this thing
5:01 called trending application right
5:03 typically when you look at application
5:05 views you always get that pretty pie
5:07 chart about topics application and top
5:09 talkers but have you ever thought about
5:13 how is the trend of applications being
5:16 used impacting my network right I'll
5:18 give you an example we talked about chat
5:20 GPT 3 and N4 and you all heard about
5:23 Enterprise talking about policies of
5:25 letting their employees know hey do not
5:27 use chat GPT for confidential questions
5:30 wouldn't you like to know how many users
5:32 in your network actually using llm and
5:34 how is that trending across the user
5:36 population that again is immense amount
5:39 of data power of cloud we can ingest
5:42 that data part of premalytics we can
5:44 help you now visualize that data to see
5:46 which users what's the type of
5:48 application what's the usage over time
5:51 not just a snapshot in time but over
5:53 time right
5:56 next one is RF insights again West
5:58 talked about RM we talked a lot about
6:00 what we you know the symbiotic
6:02 relationships we have today that RM
6:03 helps break the deadlock on
6:05 but again talking about longer term
6:07 Trends the question always comes up
6:10 it's great that RM did
6:12 the optimization for my RF network but
6:15 what's my overall Channel utilization
6:17 like what's that evidence that RM is
6:19 acting on what is actually going on with
6:21 my RF Network Prem analytics has the
6:23 answer the second question that comes up
6:26 is okay tell me what changes did RM do
6:28 how many times it changed power how many
6:30 times did it change channels what was my
6:32 my biggest issue or the reason why RM
6:36 did what it did and as part of this
6:38 again working with our customers came
6:40 down the DFS impact right which is the
6:43 most offending DFS Channel that I see
6:45 continually that's causing RM to then
6:49 change channels at the appropriate times
6:52 to not impact users but that level of
6:54 visibility again is what we're able to
6:56 provide by giving this longer term Trend
6:59 this analysis on the contextual data
7:02 last but not least understanding
7:04 interfere instance yes I have a silly
7:06 question about the name of the product
7:08 you keep saying premium is that an
7:10 add-on product that's above and beyond
7:13 something else that you're buying extra
7:14 usually if you buy the premium package
7:16 like it's a
7:18 thing so we have a premium package which
7:20 gives this to you as part of the bundle
7:22 so you get the license exactly you turn
7:25 on exactly okay it's an offering from
7:27 the cloud essentially right now the
7:30 question about that I'm glad you
7:31 answered that question
7:33 a lot of customers say give me the raw
7:35 data and I will build my own
7:37 visualization which is fine we have all
7:39 the apis but I will tell you this 99.99
7:42 personal time those same customers come
7:44 back and say I have a bi team I'm not
7:47 going to get their time of day Juniper
7:50 missed what can you help me do right and
7:52 that's exactly what led to this stream
7:53 offering coming into play saying we have
7:56 the data we can be your bi tool to give
7:58 you the business insights you're looking
8:00 for here is a solution okay so can can
8:03 the reports I mean because right now I
8:05 have it there's like some pre-canned
8:06 reports and stuff that showed up in
8:08 there everything that I can use from a
8:09 demo and show the customers
8:10 if I want if I'm looking for something
8:12 very specific or if a customer is
8:13 looking for something very specific
8:14 that's not in there is that something
8:15 that can be requested and absolutely
8:17 okay yeah and within two to four weeks
8:19 you'll see a turnaround time you'll see
8:21 that report available to you okay so but
8:23 the key part here is this again it's all
8:25 about the longer term observability
8:27 right from a real-time troubleshooting
8:28 perspective Marvis does does for you
8:31 what it does today right you saw the the
8:33 efficacy chart of Marvis working on
8:35 customer tickets and answering questions
8:37 but the the point that we always keep
8:40 coming across working with customers is
8:42 just give me that longer term trend of
8:45 these contextual insights so that I can
8:46 make more business decisions about my
8:49 network planning for the future right uh
8:51 I'm showing you now Wi-Fi security
8:53 insights for you again vids whips has
8:56 been there for decades it's nothing new
8:58 but the visibility we're able to now
9:00 provide with okay which alerts am I
9:02 seeing consistently over a longer period
9:03 of time you saw an alert now you took an
9:05 action on it it coiled down tomorrow I
9:07 have new alerts what is that trend is
9:10 the action I'm taking sufficient to keep
9:12 my security alerts down person to a
9:14 certain minimum or I keep saying new
9:16 issues come up again and again and
9:18 therefore do I need to do now a policy
9:20 change to prevent that trend from
9:21 happening right so this is where again
9:23 your eyes open up your blindfold gets
9:26 removed again getting a longer term view
9:28 of the contextual insights we already
9:29 have in the Miss cloud
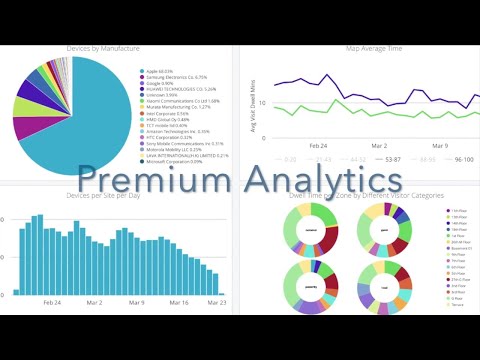
9:31 and last but not least where our journey
9:33 began line of business analytics right
9:35 the question that often come up whether
9:37 it's the corporate space whether it's
9:40 retail stores whether it's public venues
9:42 whether it's even Healthcare hospitals
9:44 where are my people coming from where
9:47 are they going where are they spending
9:49 more time and this again uh don't want
9:52 to put a plug here for location but I
9:54 can't help it that's dear to my heart
9:55 this data can be done either based on
9:58 Wi-Fi signals coming from devices or it
10:01 can also be based on the Bluetooth
10:03 mobile application that are indoor
10:04 location enabled or even Bluetooth asset
10:07 tags so given that we have this
10:10 phenomenal Bluetooth directional antenna
10:12 array built into our APS we can use that
10:14 as a source of location as well to feed
10:16 data into the line of business analytics
10:18 and again this is all about driving
10:20 business outcomes where are people
10:22 spending more time do I have a
10:24 congestion do I have a hot spot what is
10:26 my average dwell time in certain
10:28 locations versus others all can now be
10:30 delivered with these business insights
10:32 from Prem analytics and with that over
10:35 to you to talk to you about customer
10:36 momentum thank you
